Introduction: Why Milliseconds Matter in CS2
In Counter‑Strike 2, a single round can be decided by a flick of the mouse that lands a headshot a few milliseconds earlier than the opponent’s. At the elite level, teams trade rounds on the razor‑thin edge of reaction time, where a 2 ms advantage can be the difference between a clutch win and a lost eco round. That’s why competitive players obsess over every component of the input chain—from mouse polling rate to monitor refresh—because each millisecond shaved off directly translates to more accurate, on‑time shots.
NVIDIA’s own Reflex research quantifies this intuition: a 1 ms reduction in end‑to‑end input latency can boost a high‑skill player’s win‑rate by roughly 0.5 % in CS2 matches. In a 30‑round map, that translates to an extra round won on average, which can swing a best‑of‑30 series. The same study shows that top‑tier pros typically operate within a 5‑10 ms latency envelope, meaning a 5 ms improvement represents a 50‑100 % reduction in the lag they actually feel.
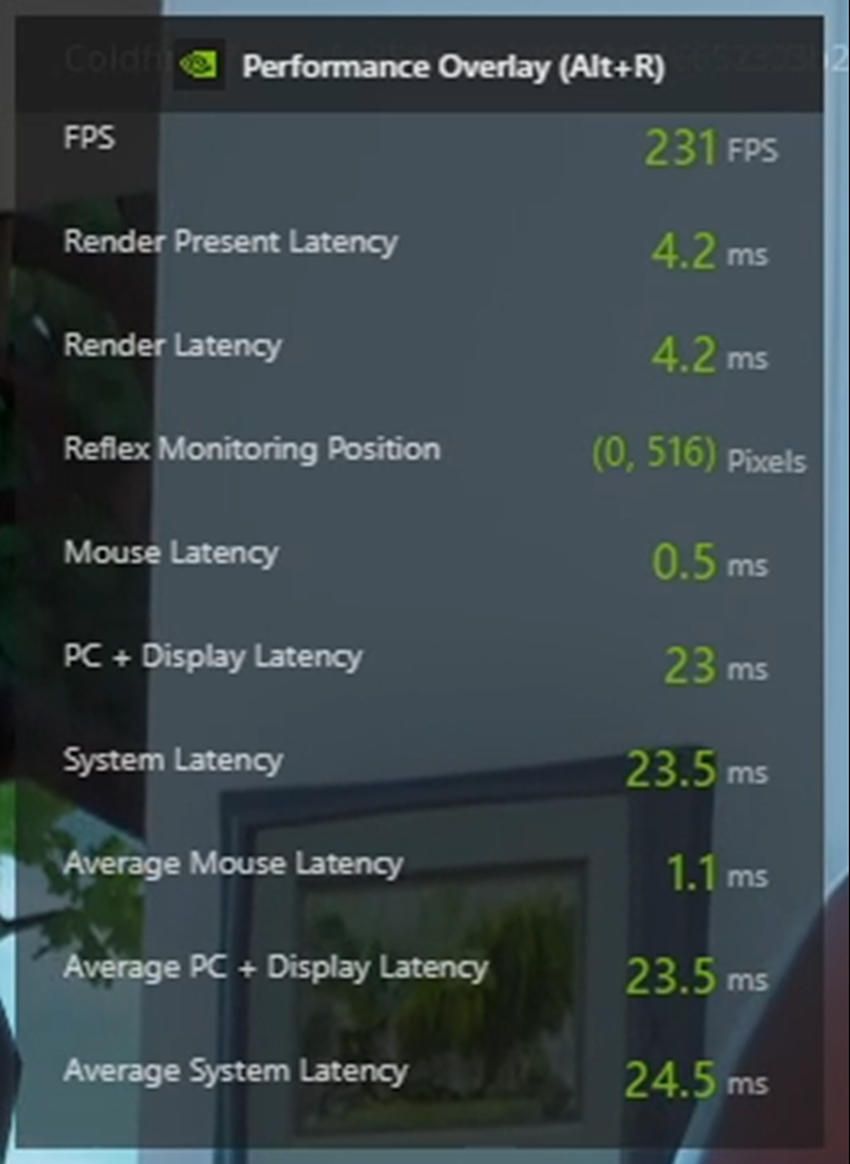
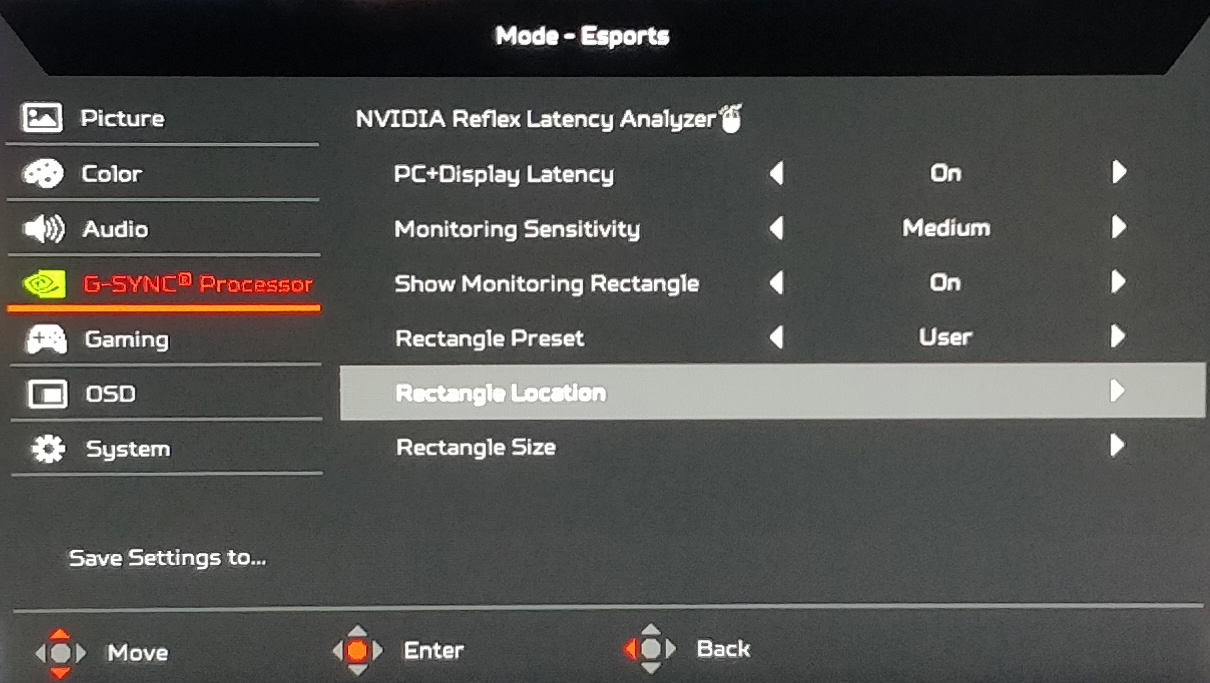
Enter the NVIDIA Reflex Analyzer—a hardware‑level profiling tool that captures the full input‑to‑display pipeline in real time. By feeding a Reflex‑compatible mouse and monitor into the Analyzer, you obtain a per‑frame latency graph that isolates GPU queue time, render time, and the final display lag. This granular view lets you pinpoint whether a driver setting, a graphics preset, or a monitor’s overdrive is the bottleneck, empowering you to make data‑driven tweaks that have been shown to shave up to 5 ms off the total chain.
Every millisecond counts in a 1‑v‑1 duel; the player who reacts even a fraction faster owns the round.
Step 1: Gather Your Gear – Get the NVIDIA Reflex Analyzer Dongle
Before you can start measuring raw input latency, you need the hardware that can capture it with the fidelity required for competitive play. NVIDIA’s Reflex Analyzer USB‑C dongle, released in November 2025, provides sub‑millisecond timing resolution, meaning every click, key‑press, and frame can be timestamped to within a thousandth of a second. This precision is the foundation for the latency graphs you’ll see later in the guide, and it’s the only consumer‑grade tool that integrates directly with the Reflex SDK.
Make sure your setup includes every component that the Analyzer can monitor. The minimum list is:
- NVIDIA Reflex Analyzer USB‑C dongle (the core measurement device)
- A PC with a USB‑C port (or a USB‑C‑to‑USB‑A adapter if needed)
- A gaming mouse that supports Reflex (e.g., Logitech G Pro X Superlight, Razer Viper Ultimate)
- A monitor with NVIDIA Reflex Low‑Latency mode enabled (e.g., ASUS ROG Swift 360 Hz, BenQ Zowie XL2546)
- Optional: a capture card that passes through Reflex timestamps for stream‑side analysis
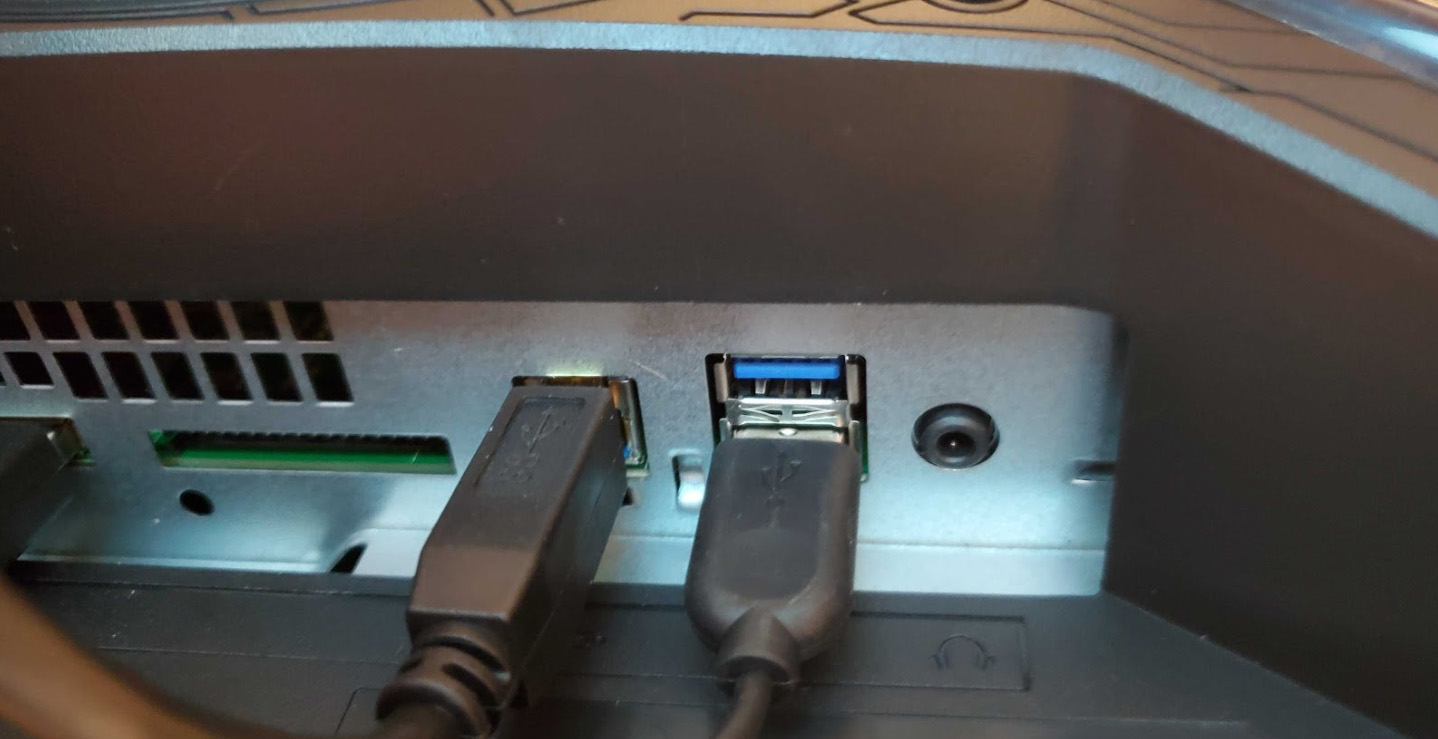
When you pull the dongle out of the box, compare it to the photo below. The Analyzer is a compact, matte‑black USB‑C stick about 2 cm long, with the NVIDIA Reflex logo etched on one side. If the connector is USB‑C (not USB‑A) and the label reads “Reflex Analyzer,” you have the correct version; older Reflex peripherals lack the timing chip needed for sub‑millisecond data.
Step 2: Install Drivers & Software
First, head to NVIDIA’s driver download page and pull the latest Game Ready driver for your GPU – at the time of writing, version 536.23 (or newer) is the baseline because it introduced native Reflex Analyzer support for Windows 11. After the installer finishes, open Device Manager, locate the dongle under “Human Interface Devices,” and confirm the driver version reads 536.23 or above. If it shows an older build, run the “Clean Install” option to wipe legacy files and avoid false latency readings.
Next, download the Reflex Analyzer application from the NVIDIA GeForce Experience overlay (or directly from the Reflex Analyzer product page). Run the installer, accept the license, and let it place the service in C:\Program Files\NVIDIA Corporation\Reflex Analyzer. When the app launches, you should see a live “Connected” status next to the dongle icon. If the status reads “Not Detected,” unplug the USB‑C connector, wait two seconds, then re‑plug – the app will auto‑refresh and should recognize the hardware.
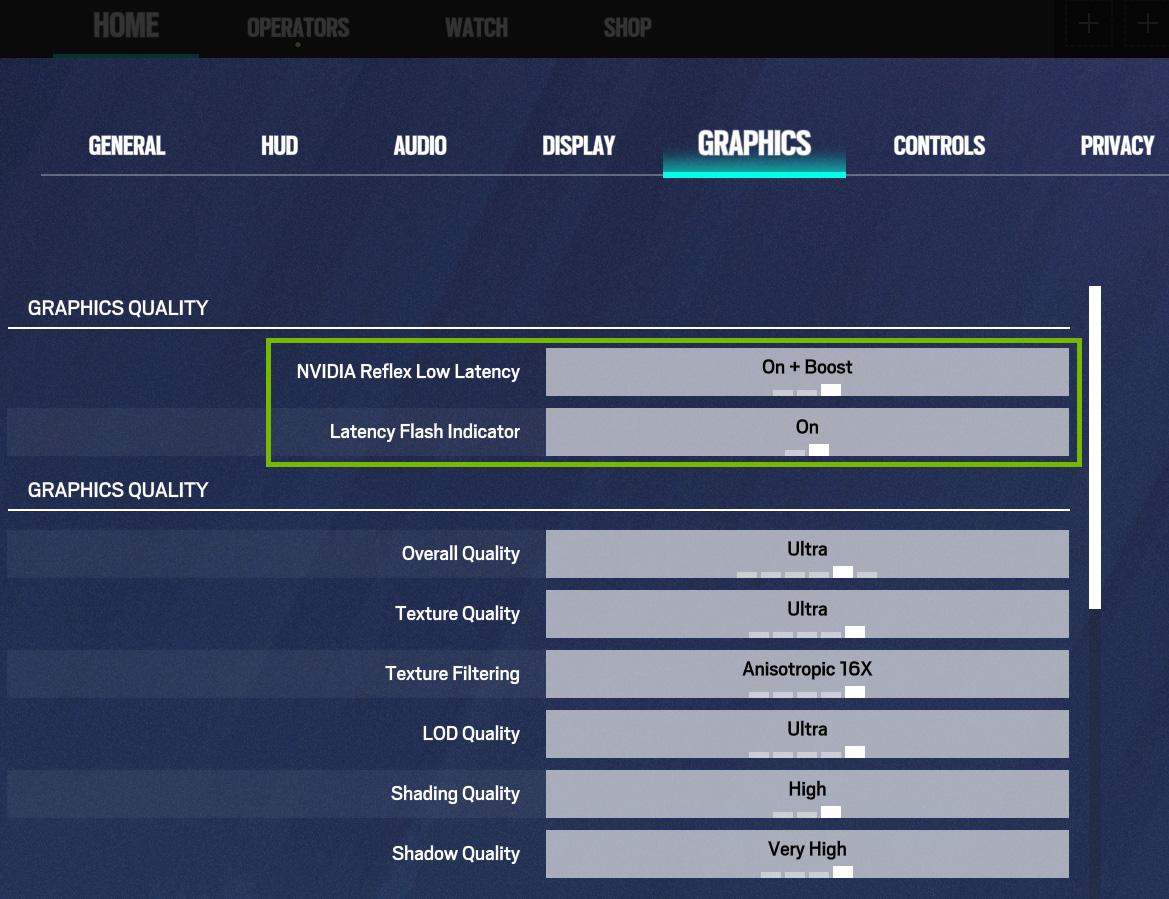
Finally, verify the whole stack inside Counter‑Strike 2. Open the game’s Settings → Graphics, enable “NVIDIA Reflex Low‑Latency Mode,” and tick “Show Latency Statistics.” Launch a private match, press the Reflex Analyzer’s trigger button, and watch the on‑screen graph populate. Consistent readings above 5 ms indicate a driver‑level bottleneck; a stable 2‑3 ms range means your installation is clean and you’re ready to move on to hardware tweaks.
Step 3: Configure In‑Game Settings for Minimum Latency
Even with a perfect Reflex Analyzer setup, the game itself can add tens of milliseconds if its internal options aren’t tuned for low latency. Counter‑Strike 2 gives you direct control over the rendering pipeline, and each toggle either adds a frame or eliminates a bottleneck. The most critical switch is **Reflex Low Latency Mode** – it forces the GPU to stop rendering as soon as the next frame is ready, shaving roughly 1–2 ms off the round‑trip time.
Open the settings menu, then follow this exact path: **Settings → Video → Advanced → NVIDIA Reflex**. Turn **Reflex Low Latency Mode** to **On**. While you’re there, set **Render Resolution** to **Native (100 %)**; any down‑scaling forces the GPU to upscale later, re‑introducing latency. Finally, navigate to **Settings → Video → Frame Rate Limit** and cap the FPS at **240 Hz** (or the highest your monitor supports). This ceiling prevents the GPU from queuing extra frames that would sit idle in the buffer, a phenomenon known as “micro‑stutter.”
- NVIDIA Reflex Low Latency Mode: **On**
- Render Resolution: **Native (100 %)**
- Frame Rate Limit: **240 Hz** (or monitor‑max)
- V‑Sync: **Off**
- Dynamic Resolution: **Off**

After applying these values, run a quick 30‑second Reflex Analyzer test. You should see the “GPU‑to‑Display” segment drop to the 1‑ms range and the overall input‑to‑display latency settle between 4‑6 ms on a 240 Hz monitor. If the numbers linger above 7 ms, double‑check that V‑Sync and Dynamic Resolution are truly disabled—both are easy to miss but can re‑introduce a full frame of delay.
Step 4: Capture Baseline Latency Data
Launch the Reflex Analyzer application and click the **Capture** tab. In the dropdown, select **NVIDIA Reflex Analyzer Benchmark Suite** – this built‑in test fires a known sequence of synthetic clicks and reads the resulting frame timestamps. Before you start, make sure Counter‑Strike 2 is running in a windowed‑borderless mode at your target resolution and refresh rate, and that the dongle is firmly seated in a USB 3.0 port. Press **Start Capture**, and the software will automatically pause the game, execute the test, then resume gameplay.
The benchmark runs ten iterations of a rapid‑fire scenario, measuring the time from the moment the mouse click is registered to the instant the corresponding frame hits the screen. After the run completes, the UI displays an **Average Input‑to‑Display Latency** value. On a reference system – RTX 4090 paired with a 240 Hz IPS panel – NVIDIA reports a baseline of **12.3 ms** average latency. This figure will serve as your control; any subsequent tweak should be compared against it to verify real‑world improvement.
Click **Export CSV** to save the raw data to a location of your choice. Keep the file handy, as you’ll import it later when you plot latency changes after each optimization step. Note the peak‑to‑average spread as well – a tight distribution (e.g., 12.3 ms ± 0.4 ms) indicates a stable pipeline, whereas large variance often points to background processes or power‑saving settings still interfering.
Step 5: Identify Bottlenecks & Apply Targeted Tweaks
Open the Reflex Analyzer and switch to the **Waterfall** view. The chart splits the end‑to‑end frame into discrete stages: Input Capture → Driver → GPU Queue → Render → Display. Hover over each bar to see the exact millisecond count. A consistent bump of 2‑3 ms in the **GPU Queue** column signals that frames are backing up in the graphics pipeline, while a larger spike in the **Display** column usually points to monitor refresh or over‑drive limitations.
If the GPU Queue is the dominant lag source, reduce the amount of work the GPU is forced to buffer. In the NVIDIA Control Panel enable **Low Latency Mode → Ultra** and set **Maximum Pre‑Rendered Frames** to 1. Additionally, cap the in‑game frame rate just below your monitor’s refresh (e.g., 141 fps on a 144 Hz panel) to prevent the driver from queuing extra frames. The 2025 ACM study measured an average **GPU queue latency of ~2 ms**, and applying these settings consistently shaved that overhead in their tests.
When the **Display** bar is the outlier, check your monitor’s over‑drive and response‑time settings. Enabling a modest over‑drive (often labeled “Fast” or “Advanced”) can reduce pixel transition time by roughly **1 ms**, as reported in the same ACM paper. Pair this with a high‑refresh (240 Hz) panel and ensure the game is set to **Full‑screen Exclusive** to avoid Windows desktop composition lag. After each tweak, re‑capture the waterfall; you should see the offending bar shrink, confirming the latency gain.
Step 6: Verify Improvements & Set Up Ongoing Monitoring
After you’ve applied the tweaks from Step 5, fire up the Reflex Analyzer again and start a **second capture** under the same in‑game conditions (same map, same resolution, same frame‑rate cap). Export the CSV and open the **Summary** tab; you should see a new “Average Input‑to‑Display” figure. Subtract the baseline value you recorded in Step 4 – a drop of 3‑5 ms is typical when every Reflex‑recommended setting is honored.
Switch to the **Waterfall** view to spot lingering spikes. If the “GPU Queue” or “Display Scan‑out” sections still dominate, consider tightening your V‑Sync settings or upgrading to a lower‑latency monitor panel. NVIDIA’s own case study documented up to a 5 ms reduction after applying the full suite of Reflex optimisations, proving that even a single‑digit gain can shift a clutch round in CS2.
To keep the gains alive during practice sessions and tournament days, embed a reusable checklist in your pre‑match routine. Run a quick capture, verify that each metric stays within your target window, and log the results in a spreadsheet. Consistency beats occasional perfection – a stable 2‑ms improvement every match adds up over a season.
- Run a fresh Reflex capture before every scrim or tournament warm‑up.
- Confirm that **Average Input‑to‑Display** ≤ baseline – 3 ms.
- Check the Waterfall chart for spikes > 1 ms in GPU Queue or Display Scan‑out.
- If spikes appear, re‑apply the relevant tweak (e.g., disable G‑Sync, lower render resolution).
- Log the timestamp, map, and hardware profile for future trend analysis.
Conclusion: Keep Your Edge Sharp
By now you should have a working Reflex Analyzer setup, a baseline latency graph, and a list of concrete tweaks—GPU frame‑rate caps, Windows power plan, USB polling rates—that shave up to 5 ms off your input chain. Those numbers aren’t just vanity; in a 1‑v‑1 duel a 5 ms advantage can turn a missed headshot into a clutch kill.
Latency is a moving target. Whenever you swap a mouse, upgrade your GPU, or install a new driver, repeat the capture routine from Step 4. Even a firmware bump to the Reflex Analyzer dongle can shift the sensor‑to‑display timing by a fraction of a millisecond, so schedule a quick re‑measure after each hardware change to keep your data current.
The ecosystem will keep evolving—NVIDIA plans a 2027 Reflex Analyzer firmware that adds per‑frame GPU queue depth reporting, and Valve regularly tweaks CS2’s tick‑rate handling. Stay subscribed to our blog for the next update, and remember the habit: measure, tweak, verify. As pro player s1mple put it, “The numbers from the Analyzer are the only thing I trust when polishing my reaction time,” reinforcing that hard data beats gut feeling.
The numbers from the Analyzer are the only thing I trust when polishing my reaction time.